Black Friday Report 2023

As we find ourselves on the other side of the year’s biggest shopping event, Black Friday, we are ready to make an evaluation. So, we crunched the numbers and built the Black Friday Report 2023 to see how merchants performed this year.
So grab a cup of coffee and dive into this year’s Black Friday performances!
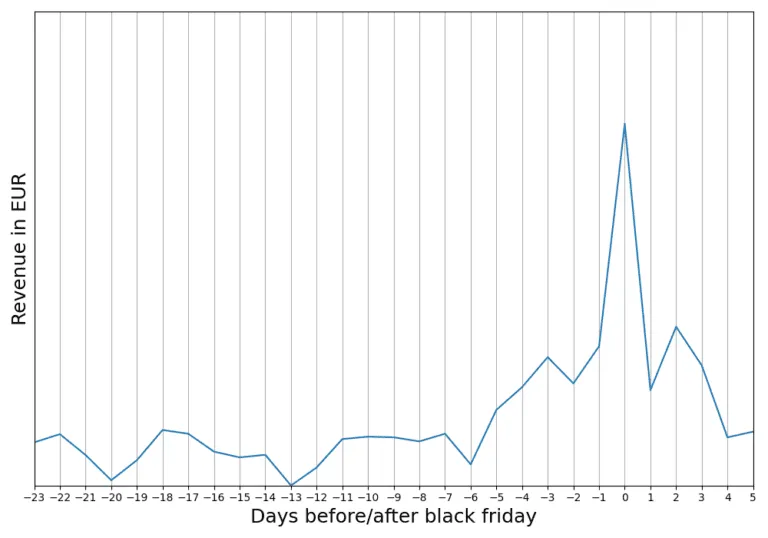
At the first glance, from the presented graph, we see a higher revenue in 2023 compared to 2022, precisely by 26%
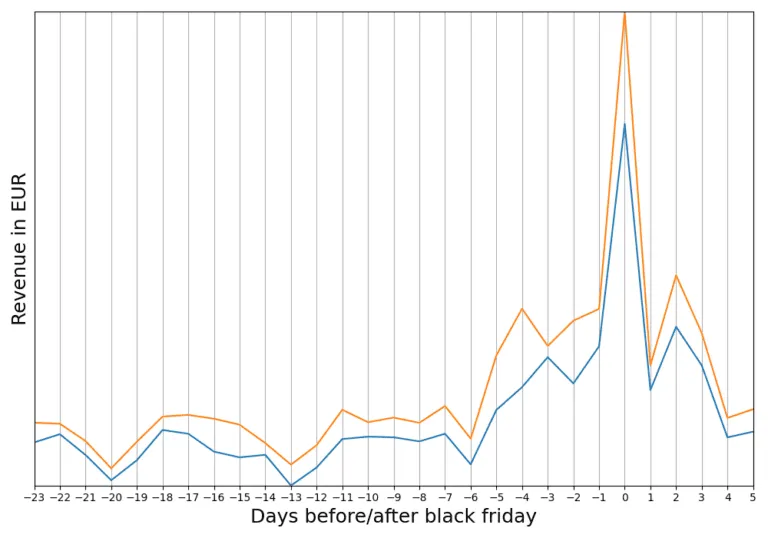
2023
2022
Revenue generated by sales during November in 2022 and 2023. All sales are converted to EUR. Growth is not adjusted to inflation. Day 0 is the day of Black Friday.
Originally, a highly anticipated and busy day for brick-and-mortar, Black Friday promotional events have been expanding into e-commerce, also covering a larger period of time, often starting a week prior, conceptualised into Black Week or even from the start of November. Therefore, for this report, we will also examine data for the entire month of November and the week leading up to Black Friday.
Nevertheless, Black Friday is undoubtedly a significant shopping event. Shopify merchants, for instance, broke a record this year with collective global sales of $4.2 million per minute at 12:01 p.m. EST on Friday the 24th. They registered a notable increase in revenue, a trend that aligns closely with our own data observations.
At Hello Retail, we supported merchants with Personalized Recommendations, Search and Pages to connect with their customers through tailored content. In this report, we analyze general performance metrics such as revenue, conversions, conversion rate, and Average Order Value.
Furthermore, we delve into Recommendations and Search performance, as well as the acquisition of new customers.
Methodology:
The data for the Black Friday Report 2023 is based on the comparison of same-store sales that occurred in November 2022 and November 2023, with an order count during both Novembers above a threshold.
Terminology:
- Conversions – The number of completed sales on the webshop.
- Revenue – The total amount of money (converted to EUR) generated through sales on the webshop.
- Average Order Value (AOV) – Average monetary value of each customer’s purchase. It is calculated by dividing the total revenue by the number of orders.
- Conversion Rate (CR) – The percentage of clicks that led to conversions.
- Click Through Rate (CTR) – The percentage of views that led to clicks on products in recommendation boxes and search.
- New customer – An individual who makes a purchase from a particular online store for the first time.
Conversions, Revenue and Average Order Value 2022 vs 2023
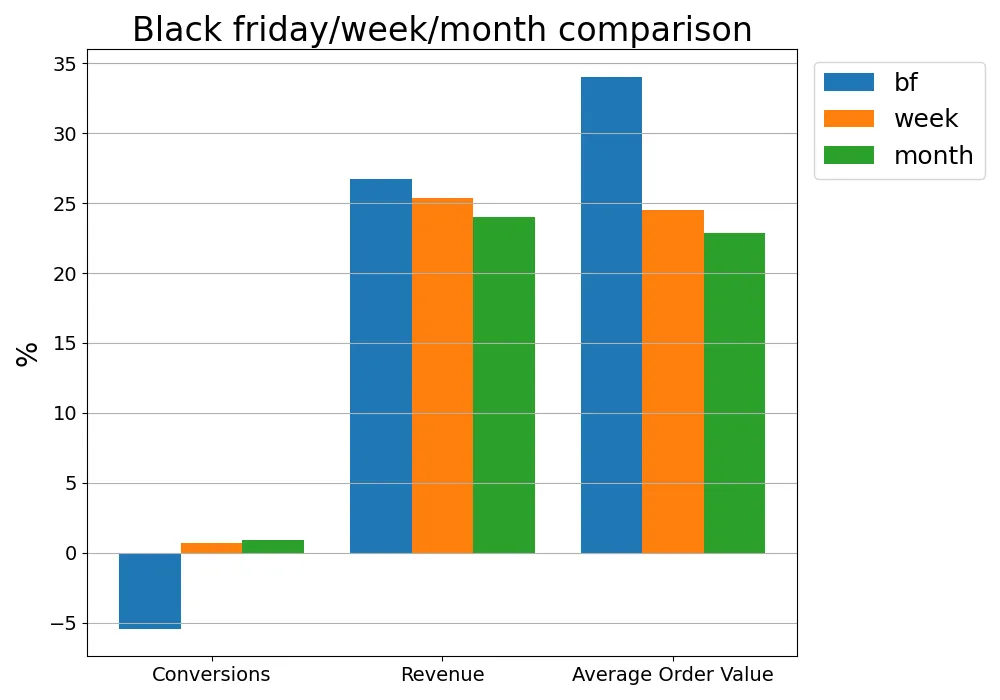
Percentage difference in conversions, revenue and AOV on Black Friday, Black Week and all of November between 2022-2023.
In previous years, the value of Black Friday was concentrated on the day itself, where discounts might only last for that one day. However, we have observed a shift as retailers extend promotions into Black Week, a trend that consumers have embraced. On Black Friday, we noticed a ~5% drop in conversions, but the sales throughout the week remained consistent. Despite this, Black Friday continues to be the day with the highest revenue, showing an increase of 26.7% compared to 2022. We observed a similar increase in revenue for Black Week, with 25.3%, and in November with 24%. These rises in revenue, coupled with slight decreases in conversions, naturally lead to an increase in Average Order Value, aligning with our observations.
Hourly conversions Thursday to Friday
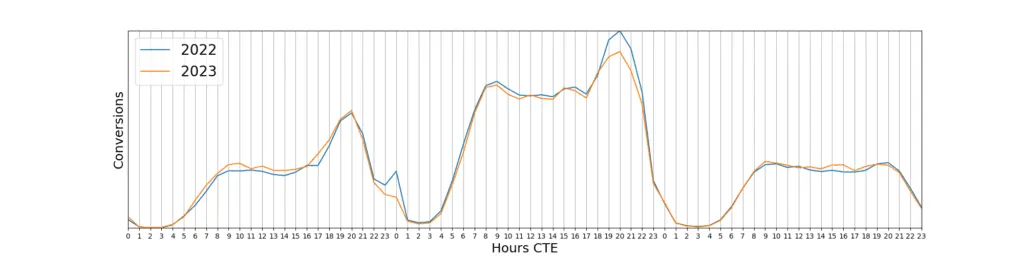
A breakdown of hourly conversions seen the day before, during and after Black Friday.
During 2022, there was a small peak at midnight on Black Friday, which has significantly decrease in 2023. This suggests that the midnight shopping craze is slowly disappearing. In the early years, we witnessed a steep increase in requests during midnight as customers accessed midnight sales. However, this year, the sales at midnight before Black Friday are lower. From the figure, we observe that throughout Black Friday, the number of sales nearly triples during the entire day compared to the days before and after.
The highest number of conversions occurs during the evening hours of Black Friday, indicating that consumers likely have the free time to browse and shop after working hours. Businesses should take note of this trend to target users at the right time.
New customers during black Friday
Black Friday campaigns often target existing customers, especially through email marketing, exclusive or early access to offers for members, or in-app notifications. Interestingly, our data shows that Black Friday is also an opportune time for acquiring new customers.
During Black Friday, we observe a surge in new customers, with a remarkable increase of 317% compared to an average day of the year, based on 11 months of data. Throughout the month of November, the daily average of new customers is 32% higher than on a regular day in the year.
| 32% | More new customers daily in November vs. rest of year |
| 132% | More new customers daily during Black Week vs. rest of year |
| 317% | More new customers on Black Friday vs. average day |
Recommendations and Search performance on Black Friday
Compared to the rest of the year, engagement with Recommendations and Search has significantly increased during this season. Conversion Rates have experienced a noteworthy uptick, while our data indicates a very small change in Click-Through Rates.
This suggests that user behavior in browsing has more or less remained the same compared to data from the other 11 months of the year. The substantial, positive change in Conversion Rates points to a significant increase in customer intent. Users are clicking on products they are much more likely to purchase. With our Personalized Search and Recommendations, webshops present the right products to the right customers, effectively meeting their intent.
Hello Retail Recommendations, Black Friday 2023
| Period | CR increase |
|---|---|
| November | 8.0% |
| Black Week | 27.8% |
| Black Friday | 64.6% |
Hello Retail Search, Black Friday 2023
| Period | CR increase |
|---|---|
| November | 6.42% |
| Black Week | 23.83% |
| Black Friday | 54.76% |
Summarizing Black Friday Report 2023
Shopping behavior is changing on the eve of Black Friday, with lower sales during midnight compared to previous seasons.
During the Black Friday season, the acquisition of new customers is exceptionally high, peaking on Black Friday itself. Merchants can seize this opportunity to gain new loyal customers with lower investments than usual.
The performance of Conversion Rates (CR) with Hello Retail’s Personalized Recommendations and Search demonstrates a high customer intent. We can presume that customers easily find relevant products and convert more efficiently on this day.
Read more about Black Friday
Check out last year’s Black Friday report and other Black Friday stuff. We’ve got some pretty cool info in there!
Keep reading
 Industry Tips
 Improve Klaviyo emails with data
Your Klaviyo flows are solid. But if every abandoned cart email shows the same generic recommendations, you're leaving revenue on the table.
 Industry Tips
 Replenishment reminders: The complete guide for ecommerce
Customers run out of products on predictable schedules. Replenishment reminders turn that predictability into repeat revenue.