
If you are reading this article, you are most probably managing an e-commerce site or perhaps are a marketer who focuses on data. Therefore, you already know that data is one of the most powerful tools an e-commerce manager can have. In this article, we explore HOW you can use Hello Retail Analytics to compare different time periods to evaluate your site’s performance with Search and Recommendations. In the second part of this article, we will explore WHY it is important to look at data this way and present you with some examples of how to leverage this knowledge for smarter decision-making.
How to Compare Periods in My Hello Retail Dashboard
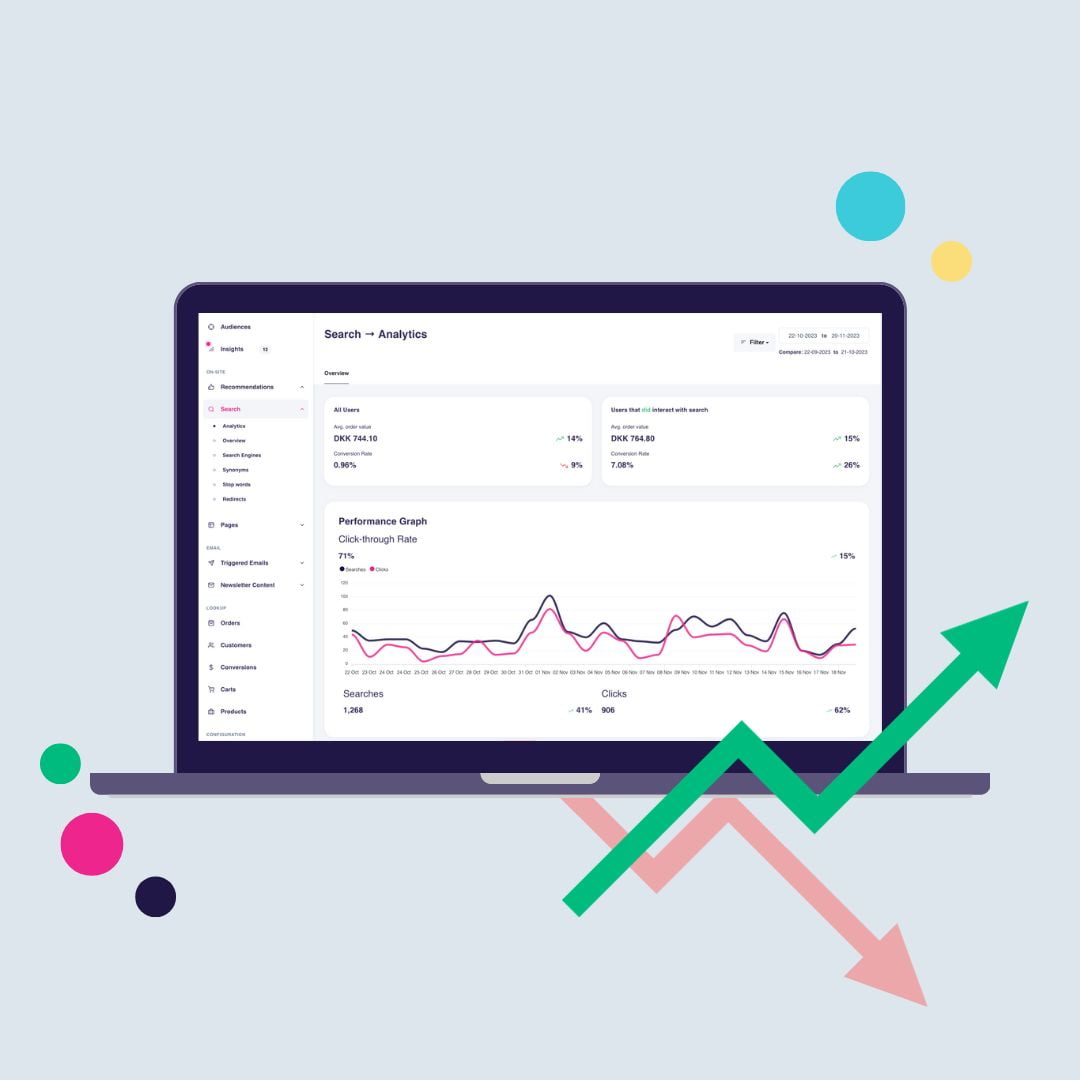
Hello Retail Solutions’ Search and Recommendations deliver personalized experiences to online shoppers to increase performance with higher conversion rates, average order value, click-through rates, and more. E-commerce managers can monitor different metrics in the Hello Retail Dashboard to evaluate how different strategies work and what can be improved. This feature gives you access to multiple combinations of data outputs, depending on your analysis objectives.

How to use this feature
1. Go to Analytics under Search or Recommendations.
2. In the right-side upper corner, you will find two date ranges. By default, it shows the current period compared to the previous one. For Recommendations, it is the last 30 days, and for Search, it is the last 14 days.
3. To compare custom periods, click on the dates. This will open a calendar where you can select to compare any date ranges.
4. Click Apply, and the data will refresh for your selected dates.
Why It Is a Good Move to Compare Periods in Analytics
Comparing different time periods in analytics for an e-commerce site is crucial for gaining valuable insights into its performance and making informed decisions. The beauty of this feature is its flexibility in applications, but here are a few examples that can give you a direction to start.
This analytical approach empowers you to make informed decisions, optimize your strategies, and ultimately enhance the overall success of your e-commerce operations.

Identifying Patterns and Trends
One primary reason for conducting such comparisons is to identify trends and patterns over time. By analyzing data across various periods, businesses can identify seasonal fluctuations, peak sales periods, and potential correlations with external factors like holidays or marketing campaigns.
Assessing Strategic Initiatives
Comparing different time periods is essential for assessing the effectiveness of strategic initiatives and marketing efforts. For instance, if a new feature or promotional campaign was launched, comparing performance metrics before, during, and after the implementation allows businesses to assess the impact of these changes. This information is instrumental in refining strategies, allocating resources effectively, and optimizing the overall user experience.
Spotting Unusual Events
Analyzing different time periods also aids in finding irregularities in performance metrics. Sudden spikes or drops in traffic, conversion rates, or other key indicators may indicate external disruptions or changes in user behavior. Identifying and addressing these issues promptly can mitigate potential negative impacts on sales and customer satisfaction.
Setting Performance Goals
Comparing historical data facilitates the setting of realistic and achievable performance goals. Businesses can establish benchmarks based on past performance, allowing for the creation of targets that align with the e-commerce site's growth trajectory. This strategic approach helps in measuring progress and making data-driven adjustments to goals and strategies as needed.
Here’s a Tip!
Dive into our Black Friday Report for 2022 to learn how different industries performed in the days leading to and during this event. Use our insights to compare with your analytics on those dates to see how you performed compared to the industry.
