New Search Analytics: Powerful Insights in your Dashboard
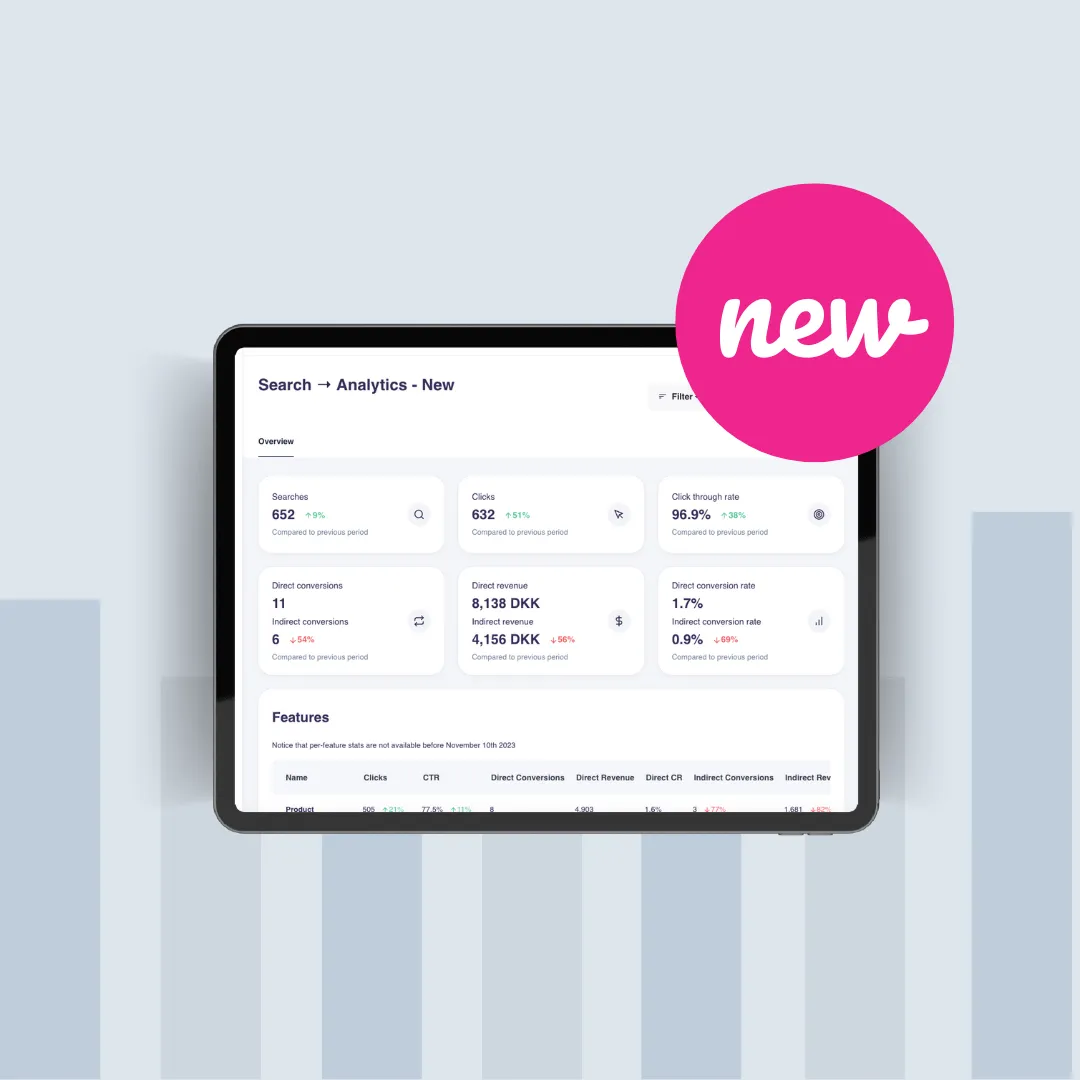
The New Search Analytics in the Hello Retail Dashboard gives you more fuel for data-driven decision-making. We have revamped the analytics dashboard with more key metrics and a more granular view on Search Features performance. In this post, we’ll walk you through the updates that aim to elevate your insights and empower your strategies.
What is new in Search Analytics?
Revenue Tracking
Follow what Revenue is generated from Search. With a quick view on the Revenue impact, it is an easier way to evaluate your ROI, and track progress.

More performance metrics
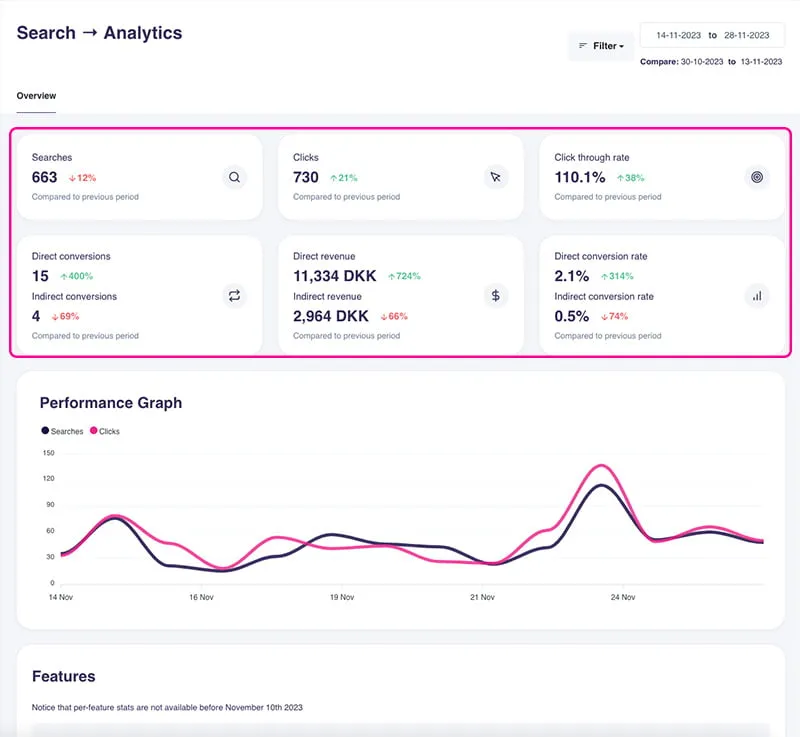
Find more metrics in the first section of the Dashboard.
- Search count
- Click
- Click Through Rate (CTR)
- ***new ***Conversions (Direct and Indirect)
- ***new ***Revenue (Direct and Indirect)
- ***new ***Conversion Rate (CR) (Direct and Indirect)
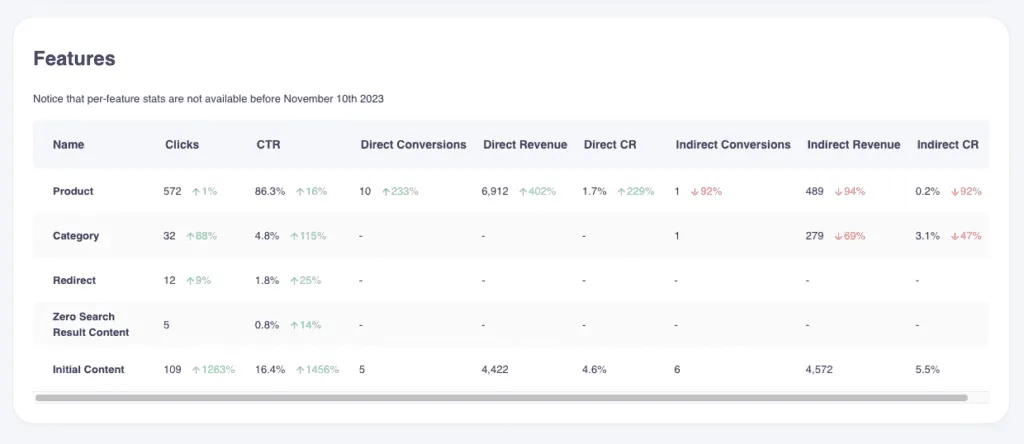
Performance for each Search Feature
Track the performance for all your active Search Features:
- Product
- Category
- AI-Synonyms
- Zero Search Result Content
- Initial Content
- Brand
- Blog Post
- Site Page
Direct and Indirect Attribution
The metrics for Conversions, Revenue and Conversion Rates are now segmented into Direct and Indirect attributions.
Direct metrics reflect the actions taken by your customers immediately connected to the Search feature. For example, if a customer clicks on a product that showed up in the results for their search query, and buys it, we will count this as a Direct Conversion for the Product.
Indirect metrics reflect the actions taken by your customers that began with an interaction with a Search feature but were completed in relation to other elements. For example, if a customer clicks on a product that showed up in results for their search query, but then continues to purchase a product shown in the recommendation box on that product page, then we will count this as an Indirect Conversion for the initial Product.
Why do we distinguish Direct from Indirect Attributions?
We want to give you a more transparent view of your performance. If the direct conversions are high, for example, it means that your customers can easily find what they are looking for. The indirect conversions will tell you that the product page, for instance, is well-optimized, and engagement is high.
The Search Analytics Dashboard
The first section shows six metrics, reflecting the overall Search performance on your site.
The Performance Graph continues to give you a glance over performance in time.
The new table with Features shows metrics for each of them, as well as the growth percentage. Notice that per-feature stats are not available before November 10th 2023.
Top Searches without results continue to show the search terms that your customers used but didn’t generate any results on your site. Directly in this table, you can add synonyms or redirects.
The Total Searches table gives you a detailed view of each search term’s performance. One of the most interesting insights is the revenue per search term, which might give you some hints about the most profitable customer needs.
Filter and Sorting Usage show statistics on your customers’ behavior. Use this data to adjust and optimize your Filter and Sorting options.
Keep reading
 Search
 Ecommerce search statistics for 2026
The data on ecommerce site search is clear: shoppers who search buy more, spend more, and convert at higher rates. Here are the statistics that matter in 2026.
 Search
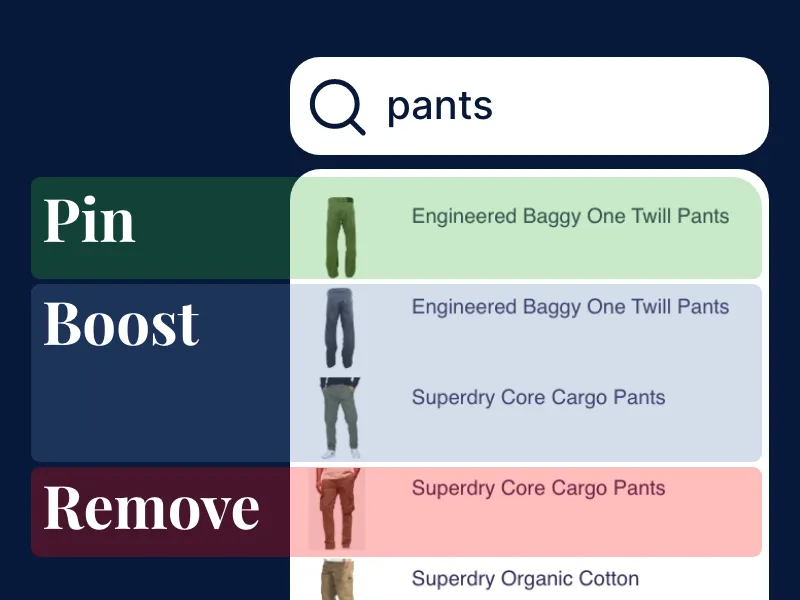
 Search Word Boosts: Precise Ecommerce Search Optimization
Control how products appear in search results for specific keywords. You can now pin, exclude, or boost products based on attributes like brand or category.
 Search
 Initial Content Upgraded: Inspire, Guide, and Convert Within Search
With this latest update, Initial Content now also includes advanced personalization features, creating a unique opportunity to capture shopper attention from the outset.