Watch the video here
or read the whole transcript below
Transcript:
Hi everyone,
My name is Kristina, and I am your eCommerce specialist at Hello Retail. My job is to help you optimize your shop for increased performance and deepen your knowledge and adoption of the Dashboard in my.helloretail.com. I believe this information will help you become more self-sufficient, and you will be able to find the crucial information you need when you need it.
We are here for you, of course, but this series focuses on showing you how much you can see and do on your own within the Hello Retail platform.
Today, we are going to look in-depth at the main Dashboard.
Start by opening my.helloretail.com and log in with your credentials- the email and password you signed up with. This will take you to the Webshops overview page, where you can click on the domain you are interested in. Doing so will load the main Dashboard.
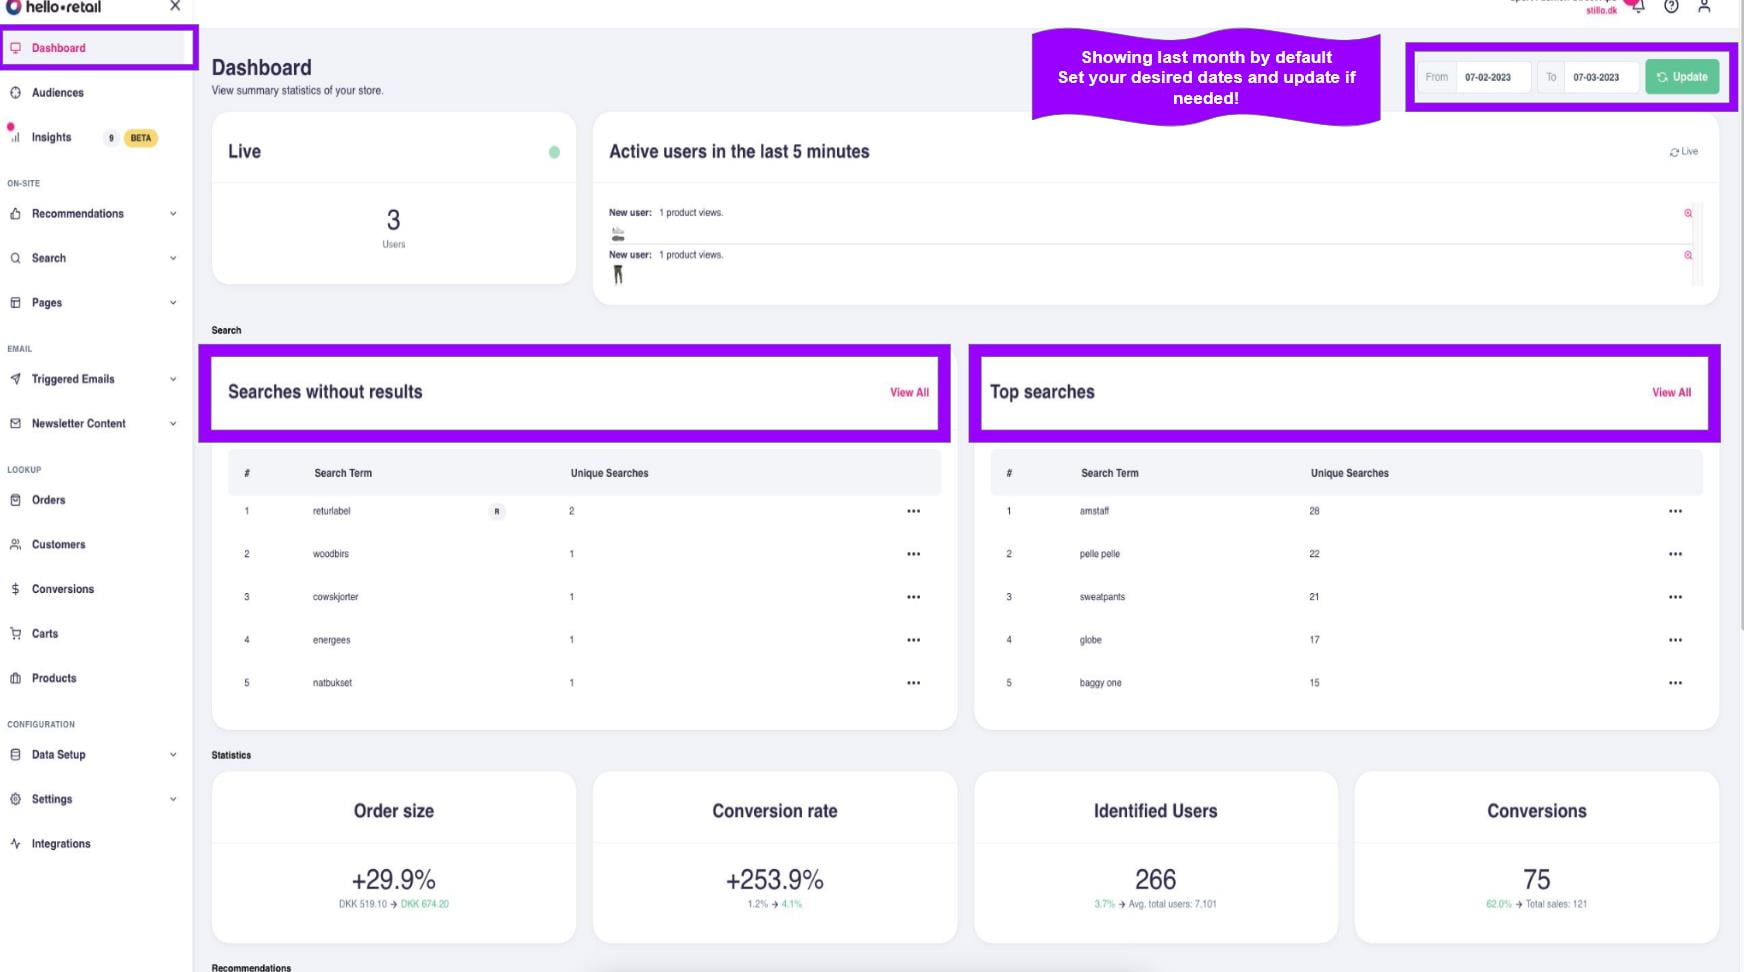
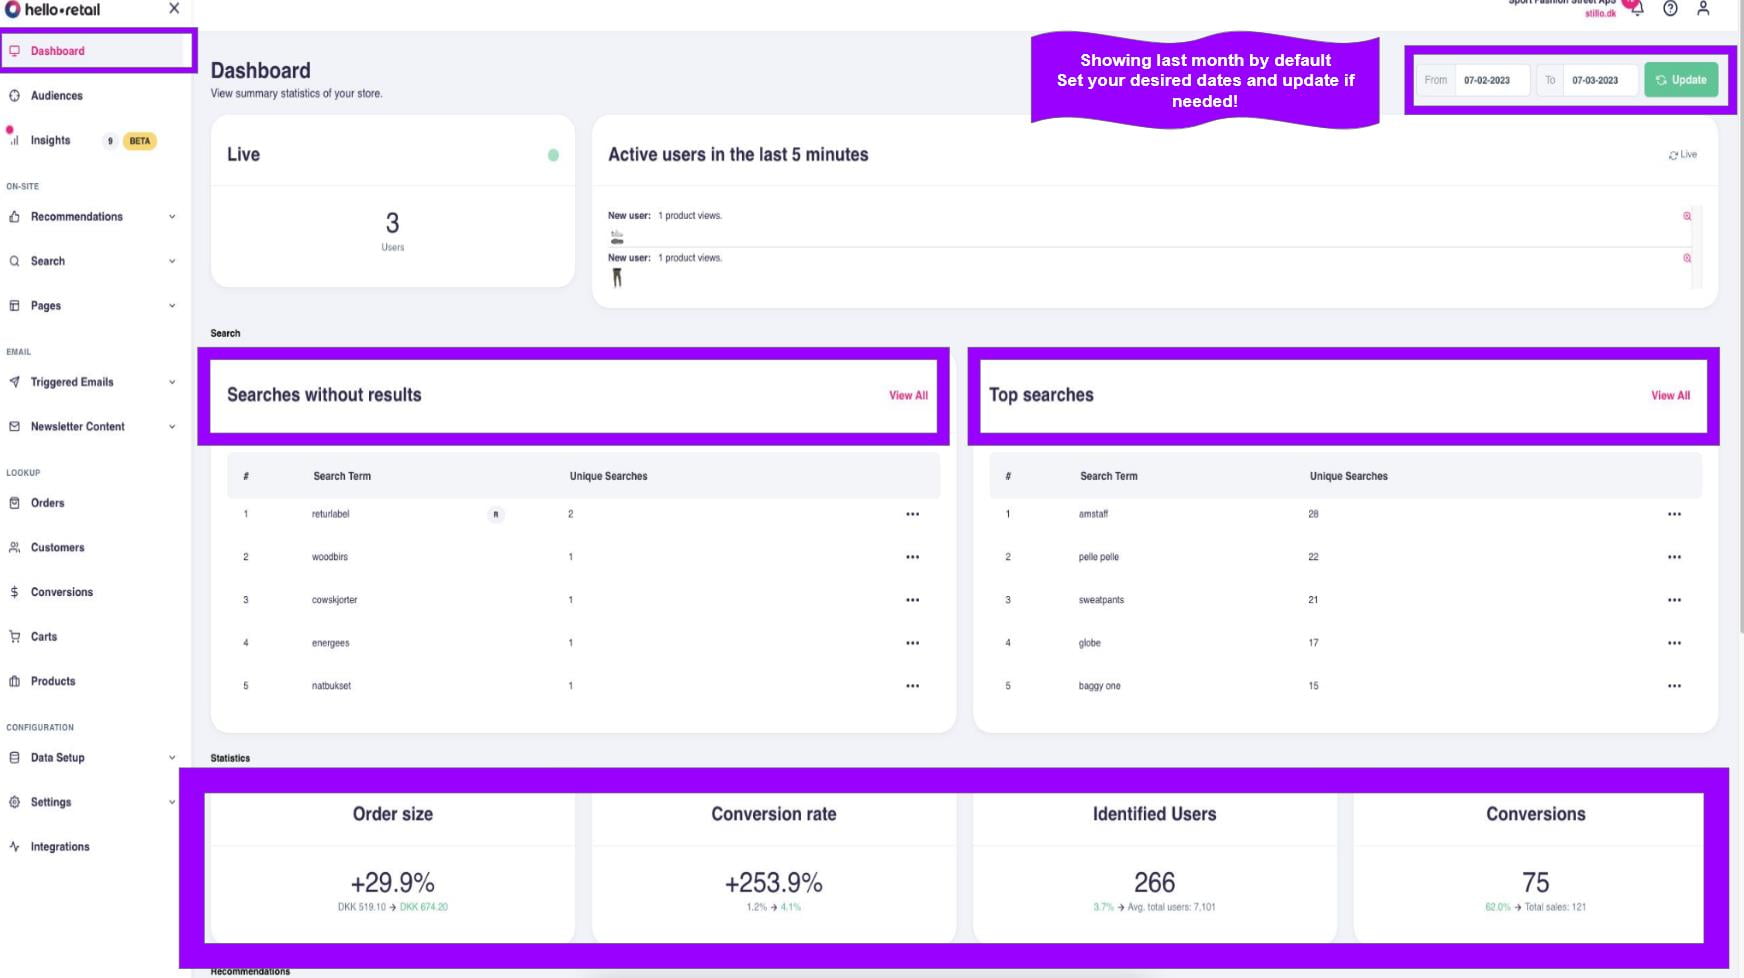
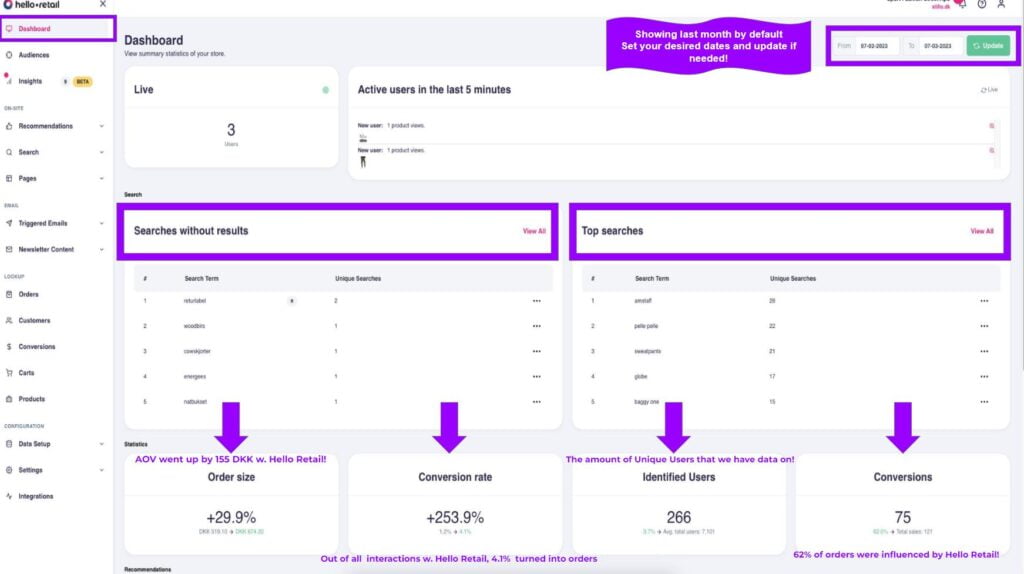
By default, it is set to show you the figures of the last 30 days, but should you want to look at the numbers for another period in time, you can change the from and to date from the date picker at the top-right of the page and click update, when happy with your selection. That will render the new figures.
Now, let’s talk about the different things we can see here. The customer we are looking at is using both Search and Recommendations. In that case, the Dashboard highlights the numbers accumulated for the last month for the combined solutions.
At the top of the page, you can see the number of active visitors to your store in the last five minutes. Below, you can see the Top searches and Searches without results- the search terms that did not generate any results. For the latter group, you might want to add synonyms or redirects. There are two ways of achieving this- from the dotted menu or under the Search product section in the main menu. I will show you in detail how to do that in another video. You can also access an extended version of the two Search analytics boxes by clicking on the View all button, which can serve as a shortcut.
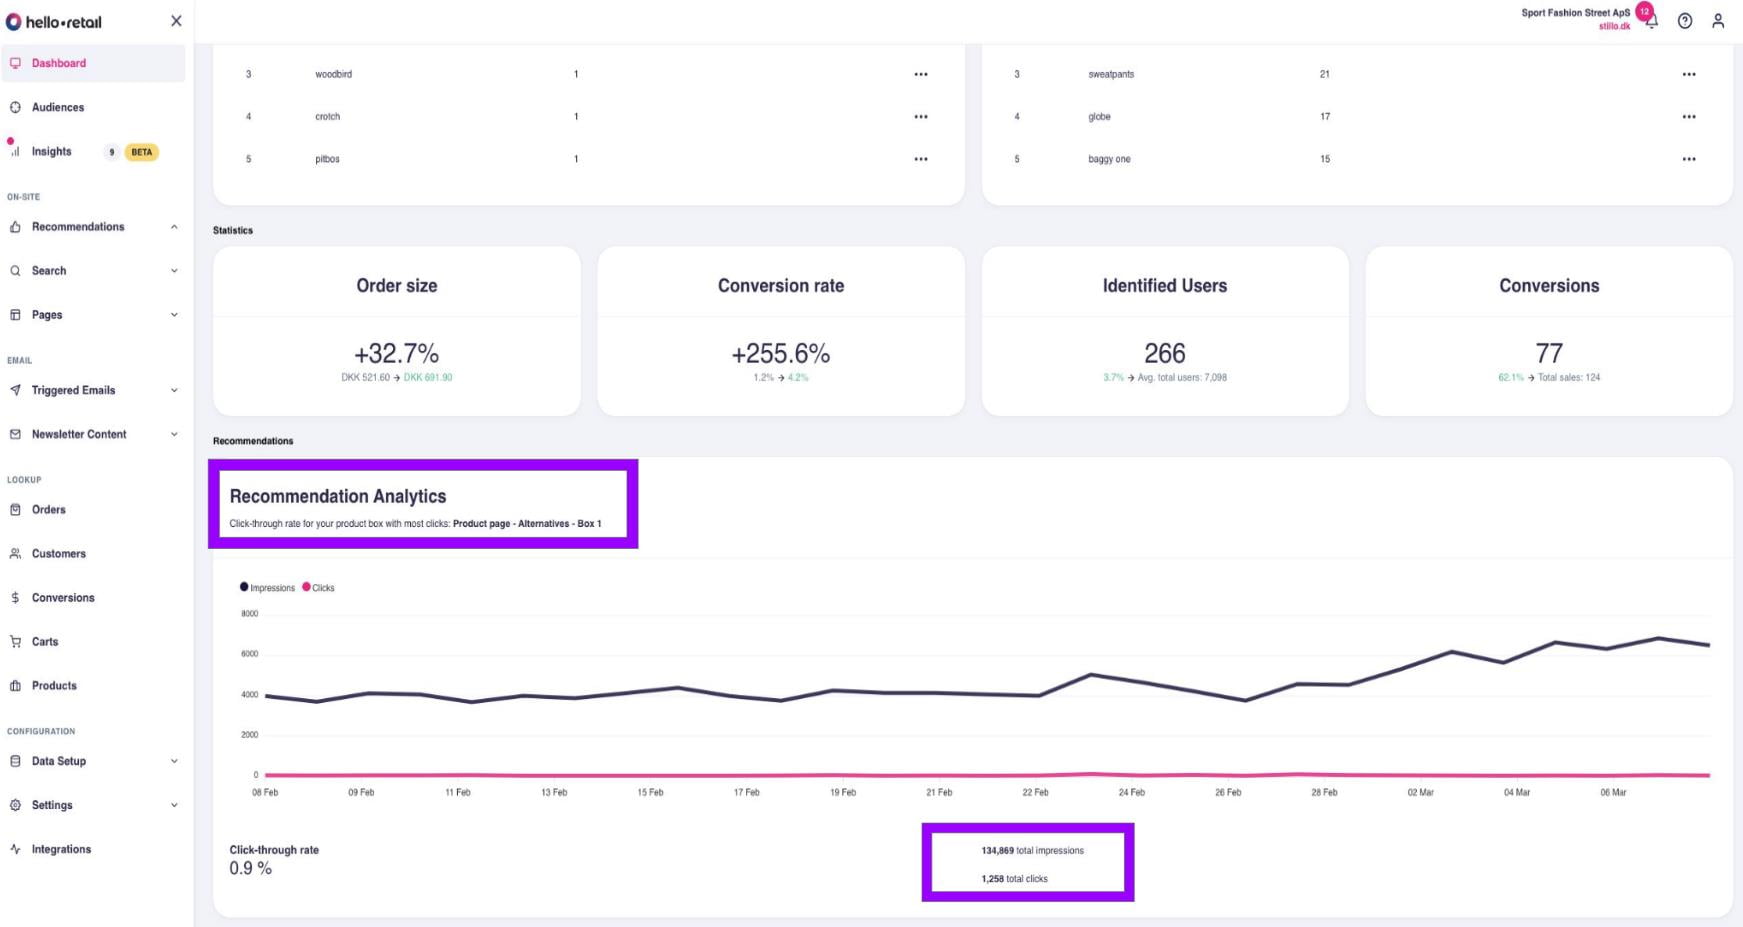
First, let’s look at the Conversions. That describes the number of orders in your store for the selected period. In the example we are looking at, 75 out of the total 121 purchases, or 62% of the total order count for that period, were influenced by shoppers interacting with Hello Retail.
We then look at the Identified users. Here, we do not describe the sessions, but the unique users that we have recognized have visited your store.
Next up is the conversion rate. You will notice a green number here indicating the growth in the portion of customers who interacted with Hello Retail and turned into paying customers. The figure in black points to the conversion rate of the shoppers who did not interact with Hello Retail’s product recommendations or search.
Moving on to the order size. The green figure indicates growth in the Average order size for people who interacted with Hello Retail’s elements compared to those who did not.
As we move down the Dashboard page, we are met by vital metrics for your business. These are looking at the combined solutions.
The last thing on the main Dashboard page presents your best-performing recommendation box. Note that it does not indicate the conversion rate or revenue generated. Instead, it focuses on impressions, clicks, and click-through rates. Under the label Recommendation Analytics, you can also see the title of your best-performing product box.


