How to measure ecommerce personalization ROI (with real numbers)
Measuring personalization ROI: The practical framework for ecommerce teams
Companies that excel at personalization generate 40% more revenue from those activities than average players, according to McKinsey's 2021 analysis. BCG's 2025 Personalization Index found that personalization leaders achieve 10 percentage points higher CAGR and significantly better shareholder returns. The opportunity is worth $2 trillion over the next three years, but only 10% of companies qualify as leaders.
The reason most companies aren't in that top 10% isn't that they haven't invested in personalization. It's that they can't prove it's working.
You've invested in personalization. Search results are personalized. Product recommendations are running. Your CEO asks: "Is it working?" Revenue is up 12% quarter over quarter, but you also launched three new products, ran a Black Friday campaign, and redesigned the checkout page. How much of that 12% came from personalization?
Here's the framework that answers that question without a data science team.
The business case in numbers
Before measuring your own ROI, it helps to know what good looks like. These benchmarks come from named studies with large sample sizes:
Revenue impact:
- Companies that personalize well generate 40% more revenue from those activities vs. slower-growing competitors (McKinsey, 2021)
- Effective personalization produces 5-15% revenue lifts and 10-30% marketing ROI improvement (McKinsey, 2021)
- Personalization leaders grow at a 10 percentage point higher CAGR than laggards (BCG Personalization Index, 2025, 200 brands surveyed)
Dollar-for-dollar return:
- 26% of marketers report $3-5 return per $1 spent on personalization (Statista, 2020)
- 9% of marketers report $20+ per $1 spent on advanced personalization strategies (Statista, 2020)
- 70% of retailers that invested in personalization reported at least 400% ROI (involve.me, 2026)
Recommendation-specific revenue:
- 7% of visits where shoppers clicked a recommendation drove 24% of orders and 26% of revenue (Salesforce, 2017, 150M+ shoppers, 250M visits, $550M in orders)
- Amazon attributes roughly 35% of its revenue to its recommendation engine (widely cited McKinsey reference)
These numbers establish the ceiling. Your measurement framework tells you where you are relative to it.
Method 1: The simple before-and-after
The most straightforward measurement is also the least statistically rigorous, and often the most practical starting point.
Compare your key metrics from the period before personalization to the period after:
- Average order value (AOV)
- Revenue per session
- Conversion rate
- Repeat purchase rate
If all four improved after implementing personalization and you didn't make other major changes during the same period, that's reasonable directional evidence.
The obvious problem: you almost certainly did make other changes. Ecommerce stores don't stand still. You're constantly updating products, running campaigns, and adjusting pricing.
Before-and-after works as directional evidence, not proof. Use it to establish a baseline, then move to more rigorous methods.
Method 2: A/B testing individual touchpoints
The gold standard for measuring personalization ROI is an A/B test where you show personalized experiences to one group and default experiences to another.
Industry benchmarks suggest 5-15% improvement per successful personalization test (Convert.com), with stores combining testing and personalization seeing 20-40% conversion improvements vs. generic A/B testing alone (Growth Engines, 2026).
What to test:
- Personalized search results vs. default search results
- Personalized product recommendations vs. bestseller recommendations
- Emails with personalized product selections vs. generic products
How to measure:
- Revenue per visitor in each group
- Conversion rate per group
- Average order value per group
- The difference between groups, expressed as revenue uplift
Sample size matters. For a store with 50,000 monthly visitors, you need roughly 2-4 weeks of data to reach statistical significance on conversion rate differences. For AOV differences (which have higher variance), plan for 4-6 weeks.
The pitfall: Don't run too many simultaneous A/B tests. If you're testing personalized search, personalized recommendations, and personalized emails all at once with overlapping audiences, you can't cleanly attribute results to any single change.
Segmentation-driven tests produce 2.8x better ROI than blanket population tests (CXL / Convert.com). Test different personalization strategies for different audience segments rather than one-size-fits-all.
Start with one test. Measure it cleanly. Move to the next.
Method 3: The holdout group (recommended for ongoing measurement)
If your personalization platform supports it, maintain a permanent holdout group: a small percentage (5-10%) of visitors who always see the non-personalized experience.
This is the most practical ongoing measurement because it doesn't require starting and stopping experiments. You always have a control group to compare against.
What to track monthly:
- Revenue per session: holdout vs. personalized
- Conversion rate: holdout vs. personalized
- Pages per session: holdout vs. personalized (personalization should reduce the number of pages needed to find relevant products)
Best practice is to run holdout groups for 3+ months before drawing conclusions (Measured.com / CXL). Over time, the holdout group data gives you a running estimate of personalization's incremental value. You can report to your CEO: "Visitors who see personalized experiences generate X% more revenue than those who don't."
The statistical validation problem. A 5-10% holdout on a store with 50,000 monthly visitors gives you 2,500-5,000 non-personalized sessions per month. That's enough for aggregate conversion rate comparisons. But for individual touchpoints (search personalization specifically, where only a fraction of visitors search and behavior varies widely by intent) you may be underpowered. The practical fix: rather than trying to attribute everything simultaneously, periodically toggle individual personalization touchpoints off for the personalized group. Turn off recommendation personalization for two weeks while keeping search and email personalized. Then restore it and turn off search personalization. This controlled subtraction isolates each channel's independent contribution without requiring statistical modeling, just patience and discipline.
Cross-channel measurement: The funnel view
Personalization doesn't happen in a single touchpoint. A customer might discover a product through personalized search, see it reinforced via product recommendations on the product page, abandon the cart, receive a recovery email with personalized alternatives, and finally convert through a price drop alert. Measuring only individual touchpoints misses the compound effect of the full personalization funnel.
Track these cross-channel indicators:
- Multi-touch conversion paths: What percentage of conversions involved 2+ personalized touchpoints? If personalization only appears at one point in the journey, you're leaving compounding value on the table.
- Customer retention and loyalty lift: BCG's 2025 research found that personalization leaders see measurably higher customer retention. Compare repeat purchase rates between your holdout and personalized groups over 6+ months; the gap should widen as personalization builds individual customer relationships.
- Push notification and app engagement: For stores with mobile apps, personalized push notifications (back-in-stock, replenishment reminders) add another measurable channel. Track incremental revenue per push notification compared to generic broadcast pushes.
The cross-channel view matters because customer expectations have shifted. Customers increasingly expect the shopping experience to feel connected: what they searched for should inform what they're recommended, which should inform what emails they receive. Measuring personalization in silos understates its value.
When to retire the holdout group. There's a point where the 5-10% revenue sacrifice from non-personalized experiences is no longer justified by measurement value. If your holdout data has been stable for 6+ months (consistently showing the same uplift range) consider reducing the holdout to 2-3% or running it intermittently (one month on, two months off). Your measurement methodology should mature alongside your personalization sophistication: early on, you need the holdout to prove value; later, touchpoint-level metrics and trend analysis may be sufficient.
Attribution by touchpoint
Not all personalization touchpoints contribute equally. Breaking down ROI by touchpoint reveals where your investment pays off and where it needs work.
Search personalization: Compare revenue per search for personalized vs. default results. Track the percentage of searches that lead to a purchase. Given that search users convert at 1.8-6x higher rates than non-searchers (Econsultancy, 2024), this is often the highest-impact touchpoint.
Product recommendations: Track recommendation click-through rate, recommendation-attributed revenue (purchases where the customer clicked a recommendation before buying), and AOV uplift for sessions that included recommendation clicks. The Salesforce benchmark (7% of visits driving 26% of revenue) gives you a target.
Product Agents: Measure incremental revenue per agent, by behavioural trigger type (abandoned cart recovery, replenishment reminders, price drop alerts, back-in-stock) and by surface (on-site recommendations, newsletter content, push). Compare each agent's revenue per interaction to your batch campaign benchmark; the gap is the incremental value of agent-driven personalization over generic broadcasts.
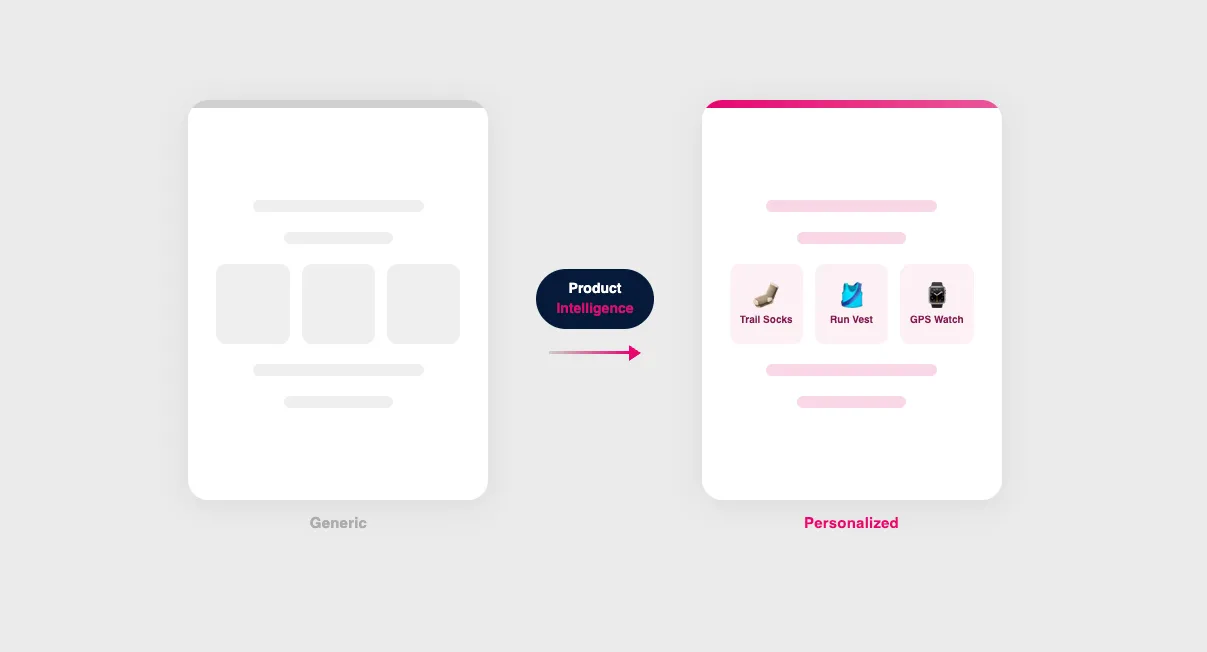
The connection to data-driven personalization: As your personalization matures from basic behavioral reactivity to true customer understanding powered by Product Intelligence, the ROI of each touchpoint should increase. Tracking touchpoint-level metrics over time shows whether your personalization is getting smarter.
The three metrics that matter most
If you only track three things, track these:
1. Personalization revenue share
What percentage of total revenue is influenced by personalization? This includes:
- Revenue from recommended products (customer clicked a recommendation before purchasing)
- Revenue from personalized search results (customer found the product via search)
- Revenue from triggered emails (customer clicked through from an automated email)
A healthy personalization program influences 15-30% of total revenue. The Salesforce benchmark of 26% from recommendation-influenced visits suggests what's possible with a single touchpoint. If you're below 10% across all touchpoints, either the personalization isn't effective enough or it isn't deployed widely enough.
2. Revenue per session uplift
The percentage difference in revenue per session between personalized and non-personalized experiences. This is your cleanest measure of incremental value.
For SMB ecommerce stores, a 5-15% uplift is typical for well-implemented personalization (McKinsey, 2021). Higher uplifts are possible with more sophisticated product intelligence driving the recommendations.
3. Recommendation click-through rate
How often do customers engage with personalized suggestions? This is a leading indicator: if CTR is low, the recommendations aren't relevant, and revenue impact will follow.
Benchmark: 3-8% CTR on product page recommendations. Below 3% suggests the recommendation quality needs improvement. Above 8% suggests strong product-customer matching.
Practical reporting template
Create a monthly one-page report with these elements:
Headline metric: Revenue per session uplift (personalized vs. control/holdout)
Touchpoint breakdown:
- Search: revenue per search, zero-result rate
- Recommendations: CTR, attributed revenue, AOV impact
- Triggered emails: revenue per email by trigger type
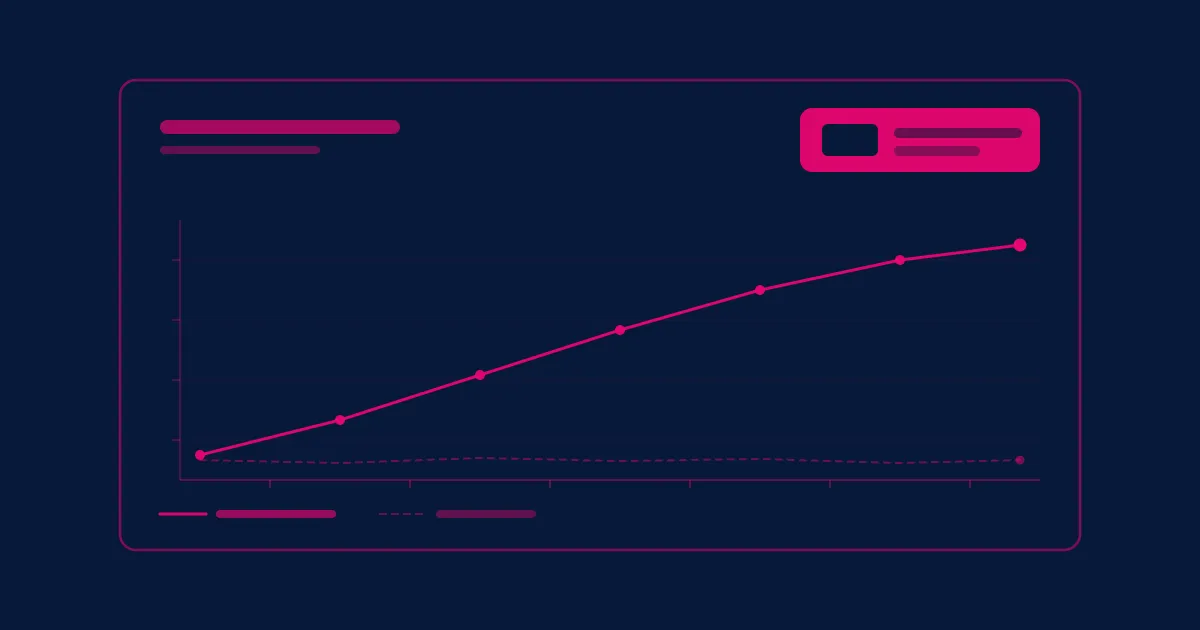
Trend line: Plot revenue per session uplift over the past 6 months. Is personalization getting better over time? (It should be, as the system accumulates more behavioral data, recommendations improve.)
One insight: What did the data reveal this month? A new product relationship, a seasonal pattern, a customer segment that responds unusually well to personalization?
This report takes 30 minutes to compile and tells the leadership team exactly what they need to know.
How this connects to Hello Retail
Hello Retail's analytics dashboard provides personalization attribution data natively: recommendation click-through rates, search conversion metrics, and Product Agents performance are built into the platform reporting.
For stores using Hello Retail's Product Intelligence engine, the platform also provides insights into product relationships and customer patterns that feed the "one insight" section of the monthly report.
The platform also supports retail media attribution, so you can measure the ROI of sponsored product placements alongside organic personalization.
The goal isn't just measuring ROI. It's understanding why personalization is or isn't working, so you can improve it continuously.
Key takeaways
- Companies that personalize well generate 40% more revenue from those activities (McKinsey, 2021); the business case is settled
- Use holdout groups (5-10% of traffic) for ongoing, honest measurement, since vendor attribution often overstates impact
- Product recommendations drive 26% of revenue from just 7% of visits (Salesforce), a single touchpoint with outsized impact
- Track three core metrics: personalization revenue share, revenue per session uplift, and recommendation click-through rate
- Break down ROI by touchpoint (search, recommendations, emails, Product Agents) to understand where personalization adds the most value
- Create a monthly one-page report that communicates value to leadership without requiring a data science background
Keep reading
 Industry Tips
 Improve Klaviyo emails with data
Your Klaviyo flows are solid. But if every abandoned cart email shows the same generic recommendations, you're leaving revenue on the table.
 Industry Tips
 Personalization vs customization
Personalization and customization sound similar but work differently. Here's when to use each approach in your ecommerce strategy.
 Industry Tips
 GEO for ecommerce: How to get your products cited by AI search engines
68% of US Google searches now end without a click, and AI search converts better than any other channel for retailers. Here's how ecommerce stores use Generative Engine Optimization to get cited when ChatGPT, Perplexity, and Google AI recommend products.