Ecommerce site search statistics: 19 numbers that prove it converts

Ecommerce search statistics: the numbers behind better product discovery
Shoppers who use site search are among the most valuable visitors to your online store. They arrive with intent, interact with purpose, and convert at rates that dwarf passive browsing. Yet most ecommerce teams treat search as a utility — a box in the header — rather than the revenue engine the data says it is.
The ecommerce search statistics in this guide paint a consistent picture: search is where buying intent lives, and the gap between a mediocre search experience and a great one translates directly into revenue.
Quick reference: key ecommerce site search benchmarks
| Metric | Industry benchmark | Target | |---|---|---| | Search usage rate | 30–50% of all visitors | Over 30% (below 20% signals a discoverability issue) | | Search conversion lift | 1.8x–3x vs. non-searchers | Aim for 2x or more over your browse sessions | | Zero-result rate | 10–15% industry average | Under 5% (every point above is a revenue leak) | | Exit-after-search rate | Varies widely by catalog | Under 25% (higher signals a relevance problem) | | Revenue per search | Site-specific | Rising month-over-month is a healthy signal | | AOV uplift (searchers vs. browsers) | Consistently positive | Track the ratio, not just the absolute number |
These benchmarks are drawn from industry research and platform-level data. Your own store's numbers matter more than any benchmark, so use these as a starting calibration point, not a ceiling.
Site search usage and adoption
The first thing the data tells us is that search matters more than its real estate suggests.
Industry benchmarks consistently show that between 30% and 50% of ecommerce visitors use site search during their session. That range depends on catalog size — stores with thousands of SKUs see higher search usage, because browsing stops being practical at scale.
What's more telling is the behavior difference. Searchers typically view more products per session, engage with more categories, and show deeper intent signals than browsers who navigate by menu alone.
Mobile search usage has been climbing steadily. With smaller screens and less room for navigation hierarchies, search becomes the primary product discovery method on phones and tablets.
Search conversion rates vs browsing
This is the statistic that makes the business case.
Visitors who use site search convert at significantly higher rates than those who don't. Benchmarks across multiple studies and platforms consistently put search conversion rates at 1.8x to 3x higher than non-search sessions.
The pattern holds across verticals. Fashion, electronics, grocery, home goods — in each case, the searcher outperforms the browser on conversion. The reason is straightforward: a search query is a statement of purchase intent. "Blue running shoes size 10" is fundamentally different from clicking through a menu to "Footwear > Athletic."
Average order value follows a similar pattern. Searchers also tend to show higher average order values — consistent with the higher purchase intent that drives them to search in the first place. The likely explanation is that search surfaces relevant products faster, reducing friction and enabling shoppers to find complementary items they might not have discovered through navigation.
The cost of bad search
Not all search experiences deliver these results. Poor search actively damages conversion.
Zero-result searches are the clearest indicator of search failure. When a customer types a query and gets nothing back, the session typically ends there — no click, no conversion, no recovery.
Zero-result rates vary widely depending on catalog size, query handling, and how well the search engine manages synonyms and typos. Sites with poor search infrastructure can see rates above 20%; well-optimized engines push that closer to 5%. Across ecommerce broadly, reported averages typically fall in the 10–15% range — meaning roughly one in every seven to ten searches returns no results at all.
That's a significant share of high-intent moments going to waste.
That's not always a catalog gap. Often it's a language gap. The customer searched for "sneakers" but the catalog says "trainers." They searched for "BBQ grill" but you've listed it as "outdoor grill." These vocabulary mismatches are fixable — and fixing them is one of the highest-ROI changes an ecommerce team can make.
Search abandonment tells a similar story. When results are irrelevant or overwhelming, customers leave rather than refine their query. Sites with basic keyword matching consistently show higher exit-after-search rates than those using algorithms that understand intent, synonyms, and context — in some cases the difference is substantial.
AI-powered search: the numbers
The shift from keyword-matching to AI-driven search is producing measurable improvements across the board.
Ecommerce teams deploying AI-enhanced search consistently report conversion improvements over traditional keyword matching. The gains vary by implementation, but typically reflect several capabilities working together: natural language understanding, synonym detection, personalized ranking, and behavioral learning.
NLP-based search has a particularly measurable impact on zero-result rates. By understanding intent rather than matching exact strings, it converts queries that would otherwise return nothing into relevant results — one of the more direct ways search quality translates into recovered revenue.
Personalized search results — where the algorithm factors in individual browsing history, purchase patterns, and behavioral signals — add another layer. When search results adapt to the individual, click-through rates and conversion rates both improve because the most relevant products surface first.
The compound effect matters. Better relevance leads to more clicks. More clicks generate more behavioral data. More data improves personalization. The flywheel effect means AI search gets measurably better over time, widening the gap against static keyword search.
Mobile vs desktop search behavior
The split between mobile and desktop search behavior reveals important optimization priorities.
Mobile search sessions are shorter and more focused. Shoppers on mobile tend to use shorter queries, rely more heavily on autocomplete suggestions, and expect results to load quickly. Industry benchmarks suggest that even a one-second delay in search results on mobile correlates with meaningful drops in engagement.
Desktop search sessions, by contrast, show more refinement behavior. Desktop shoppers are more likely to use faceted filtering, adjust search terms multiple times, and compare products side by side. They also type longer, more specific queries.
The gap in search conversion rates between mobile and desktop has been narrowing as mobile search experiences improve. Stores that invest in mobile-optimized search — fast autocomplete, touch-friendly filters, thumb-reachable search bars — report mobile search conversion rates approaching desktop levels.
Search analytics: what to measure
The ecommerce search statistics above are industry-level benchmarks. What matters more is your own data.
The five metrics that form a complete picture of search health:
-
Search usage rate — What percentage of visitors use search? If it's below 20%, your search box might be hard to find or your navigation might be doing the heavy lifting.
-
Zero-result rate — Target below 5%. Every percentage point above that is a revenue leak. Pull the zero-result report monthly and fix vocabulary gaps.
-
Search conversion rate — Compare this to your non-search conversion rate. The ratio between the two tells you how well your search is converting high-intent visitors.
-
Revenue per search — Total search-attributed revenue divided by total searches. This is the north star metric that connects search quality to business outcomes.
-
Exit-after-search rate — How often do customers leave immediately after searching? Rates above 25% signal a relevance problem that needs attention.
For context on where these benchmarks come from: the most widely cited site search KPI data originates from independent ecommerce research firms such as Econsultancy and the Baymard Institute, which publish benchmark studies drawn from large samples of online stores and real-world user testing. Whether you run search in-house or on a dedicated platform, those five metrics remain the most consistent indicators of search health across the industry.
Tracking these metrics over time is more valuable than any single snapshot. A rising zero-result rate might indicate new product demand you're not meeting. A falling revenue-per-search might mean your search relevance is degrading as your catalog grows.
A search analytics dashboard that surfaces these metrics and connects them to action is what separates teams that optimize search from teams that just run it.
How Hello Retail approaches ecommerce search
Hello Retail's search product is built around the principle that search should be a revenue driver, not just a utility.
The platform combines AI-powered relevance with behavioral personalization — every search result factors in the individual shopper's history, context, and intent patterns. This is powered by the Product Intelligence engine, which maintains a real-time understanding of every product in the catalog and how shoppers interact with it.
In practice, this means:
-
Fewer zero results. NLP and AI synonyms catch the vocabulary mismatches that cost revenue. When a shopper searches for "sneakers" and the catalog says "trainers," the search still works.
-
Personalized ranking. Two shoppers searching for "jacket" see different results based on their browsing behavior, purchase history, and price sensitivity. The algorithm surfaces the most relevant products for each individual.
-
Search-to-recommendation continuity. Because Hello Retail unifies search and product recommendations on the same intelligence layer, what a customer searches for informs what they're shown everywhere else — on product pages, in emails sent by Product Agents, and across the site.
-
Built-in analytics. The search dashboard tracks all five metrics above, plus granular reporting on trending queries, zero-result patterns, and conversion by search term.
The result is a search experience that improves over time, because every interaction feeds back into the intelligence engine that powers it.
Key takeaways
- Shoppers who use site search convert at significantly higher rates and spend more per order — search is a revenue engine, not just a navigation tool
- Zero-result rates are the highest-ROI fix in ecommerce search — reducing them is often as simple as adding synonyms to your search configuration
- AI-powered search is producing measurable conversion lifts over traditional keyword matching, with the gap widening as algorithms learn from behavioral data
- Mobile search now accounts for the majority of ecommerce search activity — optimizing for speed, autocomplete, and touch interaction is critical
- Track five metrics consistently: search usage rate, zero-result rate, search conversion rate, revenue per search, and exit-after-search rate
The ecommerce search statistics point in one direction: search is where buying intent lives. The question isn't whether to invest in search — it's how much revenue you're leaving on the table by not doing it well.
Ready to see how your search compares? Book a demo and we'll show you the data.
Keep reading
Search Ecommerce site search statistics: 19 numbers that prove it converts
Site search users convert at 4.63% vs 2.77% for non-searchers (Econsultancy). 43% of shoppers head straight to the search bar. The full 2026 dataset on why search drives revenue.
 Search
 Plant nursery beats tech giants at personalization
A Danish plant nursery built search around when flowers bloom. Most ecommerce sites still serve the same results to everyone. The lift speaks for itself.
 Search
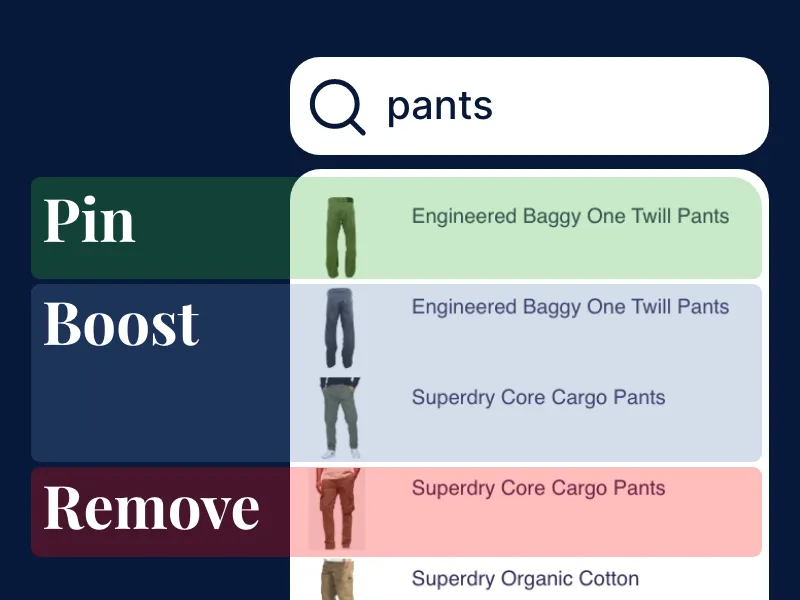
 Search Word Boosts: Precise Ecommerce Search Optimization
Control how products appear in search results for specific keywords. You can now pin, exclude, or boost products based on attributes like brand or category.